Automate Custom Charts using Google Sheets
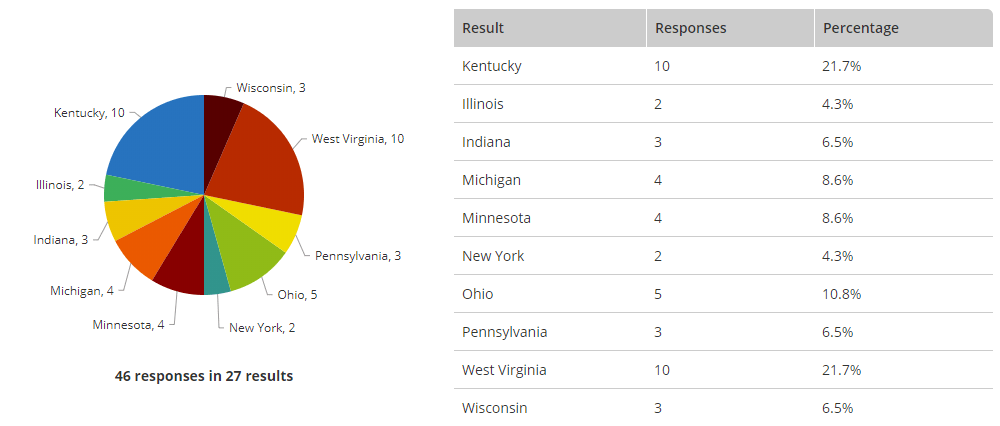
Form owners frequently ask for ways to automate custom charts and graphs for reports. Formsite provides several analytics charts and graphs for built-in reporting and analysis. These charts allow owners to see how individual questions perform, as well as:
- Percentage of each answer
- Subsets of answers using Results Filters
- Drop-off rate (where visitors abandon the form)
- Cross-tabulation (compare 2 different items)
- Inventory reports
For those not included in the built-in analytics pages, the best option to automate custom charts comes from Google Sheets. Using the integration to send new submissions to Google Sheets can also automatically update any charts.